Thursday, April 26, 2012

Feedback driven development - it's like yoga for my apps


This is the second blog post inspired (provoked?) by Nobel Laureate Daniel Kahneman’s TED talk on our "experiencing selves" and our "remembering selves". The first installment applied his theory to User Experience (UX) design principles; this installment pivots from a user’s experience of their applications to an application’s experience of its users.

Kahneman’s thesis is that our remembering self (that part of the mind that organizes experiences into stories to be replayed) dominates our decision making and that our experiencing self (that part of the mind that is in the here and now and feels things like happiness) has little residual impact on our decision making. The root cause is evolutionary. Humans are programmed to re-live the past to better anticipate the future (so that we survive). So, when we think about the future, we don’t think of our future as experiences. We think of our future as anticipated stories (anticipated memories of experiences to be had).

Yet, if we allow our life to be dictated too heavily by these memories (that are incomplete and all too often inaccurate) – the imbalance between our remembering and experiencing selves will ultimately extract a huge emotional, psychic and physical toll.

This explains why practices like yoga are so transformative and powerful to so many; yoga is all about restoring balance. Yoga is about being present physically, emotionally and spiritually – yoga is designed to offset our evolutionary programming of re-living the past to anticipate the future.  

An application’s programming is the polar opposite; an application lives 100% in the present. An application operates as pure “experiencing self.” At every given moment during an application’s lifecycle, it is the sum total of its software state, data values, exception handling, etc.) with no rendition of the past and no notion of the future. This complete lack of contextual awareness – of always and only being in the moment - is an imbalance of its own and just as unhealthy as someone who is never in the moment. User experience, software quality and security gaps are often, at their root, tied to an application’s poor contextual response in production; the absence of historical data and heuristics (a remembering self) causes all sorts of problems for an app and its users – and all sorts of grief for its creators.

The source of our respective dysfunctions (people and apps) can be traced to the differences in our respective genesis; people evolve while applications are created. Here’s the rub. Apps may not worry about the success of future generations (iterations) – but their creators do!  What are the practices that we, as application creators, can follow to ensure application balance (to optimize user experience, quality and ROI)?

Question: What is the application analog to yoga?


Answer: Feedback driven development and automated operational response to runtime behaviors.


To bring balance to applications means offsetting an application's bias to always be in the moment just as yoga offsets our tendency to be everywhere BUT in the moment. Feedback driven development and the increasingly automated and sophisticated operational responses to application events (DevOps) are designed to do just that – to ensure that both production applications and their future iterations are increasingly responsive and effective over time.

Now before we go too crazy – lets agree that analogies are not tautologies (or else we wouldn’t need two different words would we?) so we can only go so far with something like this – but here’s a little table that maps this out…

Yoga stuff
Development stuff
How they line up…
Physical, mental and spiritual well being
User experience, software quality and development ROI
What it is we’re trying to get right (fine tune)
Yoga Sutras
Agile Methodology
An organized approach to restoring balance
Hatha Yoga
ALM & DevOps
The dimension of the practice focused on the real world.
Asanas
Patterns and practices
Pose[s] or pattern(s) you can hold/implement with ease


Whether or not your willing to follow me on this yoga analogy - I think the fundamental point is that a balanced development process (and an app with maximum ROI) must make it easier for development to improve future iterations and operations to manage. Conversely, its unhealthy (unproductive) for development to favor its inherent bias - to build applications that merely meet predefined functional specifications;  it serves everyone's selfish interests to invest in practices and technologies that connect applications in production to development and operations. 

Monday, April 16, 2012

AT&T What a difference a year makes

About a year ago, my wife had gone into a local AT&T store to ask about getting a Windows Phone. The sales person wouldn't recommend one assuring my wife that there was no interest at all. The rep did confirm that Windows Phones did run Android (yes, that's what she was told).

About three months later, I visited the same AT&T store (in Legacy Village, Ohio) with my wife to activate a Windows Phone and took the time to chat up the same associate. This time she knew that the phone ran under a different operating system - she still assured me that there was little if any interest in the phone. She was happy to activate a new account for my wife using our phone and we were on our way.

My wife's phone had a flaky battery and when I revisited the same store (and saw the same associate), she remembered me (because i had shown her my app) and swapped out my battery. Great service - thanks!

This weekend, I went in to upgrade my wife to the Lumia 900 (Cyan of course). I was helped by the same associate (I swear - it's the upside to living in NE Ohio i guess), and I asked her how sales were going. She said that the phone was hugely popular - that they had gotten a shipment of phones on Friday and they were already gone. ...but for me, this was the kicker, she said, without prompting, that she wished she could swap out her iPhone for the 900 - she loved the phone!

Now, I always joke that I don't drink the cool-aid because I am the cool-aid - but here is a young woman who went from ignorance, to disdain, to tolerance and has just landed on envy. This thing might actually take-off!

Tuesday, February 14, 2012

Colonoscopies - The secret to happy users and happy apps

Of course, I love any discussion that revolves around apps and people (symmetry – not just interaction) and so I was naturally blown away by a TED talk by Nobel laureate and founder of behavioral economics Daniel Kahneman on how our "experiencing selves" and our "remembering selves" perceive happiness differently.

To quote from the abstract, “[Kahneman’s] new insight has profound implications for economics, public policy -- and our own self-awareness” – but why stop there? Let’s add “user experience” (UX) on the human front and “ALM and SDLC” on the app front. This topic is going to be kind of long, so I’m going to break up UX and ALM and SDLC into two installments; let’s do UX first. 

Kahneman’s independent research offers some of the strongest evidence yet on the importance of using stories in operations and support, app design, user training, and in product management. 
Here is how Kahneman begins his lecture – and, if you substitute “user experience” with “happiness” and “app” for “life” and “value” for “well-being,” I think his message is a profound one for developers to hear.

Kahneman concludes that “we don’t choose between [user] experiences, we choose between memories of [user] experiences. Even when we think about the future, we don’t think of our future normally as [user] experiences. We think of our future as anticipated memories.”

“Everybody talks about happiness these days. […] There is a huge wave of interest in happiness, among researchers. There is a lot of happiness coaching. Everybody would like to make people happier. But in spite of all this flood of work, there are several cognitive traps that sort of make it almost impossible to think straight about happiness.

[…] This applies to laypeople thinking about their own happiness, and it applies to scholars thinking about happiness, because it turns out we're just as messed up as anybody else is. The first of these traps is a reluctance to admit complexity. It turns out that the word "happiness" is just not a useful word anymore, because we apply it to too many different things. I think there is one particular meaning to which we might restrict it, but by and large, this is something that we'll have to give up and we'll have to adopt the more complicated view of what well-being is. The second trap is a confusion between experience and memory; basically, it's between being happy in your life, and being happy about your life or happy with your life. And those are two very different concepts, and they're both lumped in the notion of happiness. And the third is the focusing illusion, and it's the unfortunate fact that we can't think about any circumstance that affects well-being without distorting its importance.

Now, here it is after I have made my mangling substitutions:

Everybody talks about User Experience these days. […] There is a huge wave of interest in User Experience, among researchers. There is a lot of User Experience coaching. Everybody would like to make people have better experiences. But in spite of all this flood of work, there are several cognitive traps that sort of make it almost impossible to think straight about User Experience.
[…] This applies to laypeople thinking about their own User Experience, and it applies to developers thinking about User Experience, because it turns out we're just as messed up as anybody else is. The first of these traps is a reluctance to admit complexity. It turns out that the (term) "User Experience" is just not a useful (term) anymore, because we apply it to too many different things. I think there is one particular meaning to which we might restrict it, but by and large, this is something that we'll have to give up and we'll have to adopt the more complicated view of what value is. The second trap is a confusion between experience and memory; basically, it's between having a good experience in your app, and having a good experience about your app or being satisfied with your app. And those are two very different concepts, and they're both lumped in the notion of User Experience. And the third is the focusing illusion, and it's the unfortunate fact that we can't think about any circumstance that affects value without distorting its importance.

Now this is just the opening of the lecture and neither version really proves anything – he’s just setting the stage – let’s look at two examples he cites to make his (and my) point.
First, he recounts the story of someone he’d met who’d been listening to a symphony, that “was absolutely glorious music” but at the very end of the recording, “there was a dreadful screeching sound” that “ruined the whole experience.” But it hadn't. What that screeching sound had ruined were the memories of the experience. He had had 20 minutes of glorious music but they counted for nothing because he was left with a ruined memory “and the memory was all that he had gotten to keep.”
How does this relate to user experience? Well, if your app is cruising along and your user is having a blast and then BAM! your app crashes or their work is lost or or or – their 20 minutes (or even 20 hours) of positive user experience is wasted when that one “screeching sound” that is your app’s failure wipes it away.

…but it works the other way too…

He retells a well-documented study of two patients undergoing colonoscopies; patient B was subjected to a particularly painful exam that he verified by reporting on his pain every few minutes. BUT the last few minutes of his exam had no pain whatsoever. Patient A was subjected to a less painful exam – BUT their exam had the moderate-level pain throughout their relatively shorter and less extreme exam. Clearly, patient B suffered more -- their colonoscopies were longer, and every minute of pain that patient A had, patient B had, and more.

…And now Kahneman delivers the punch line; "The surprise is that Patient A had a much worse memory of the colonoscopy than Patient B.” The stories of the colonoscopies were different, and because a very critical part of the story is how it ends. It was much worse for patient A than for patient B in memory. “What defines a story are changes, significant moments and endings. Endings are very, very important and, in this case, the ending dominated.”

When something goes wrong for your user, the story isn’t over unless you let it be over. If you can get back to your user and fix or at least address their issue in some timely fashion – their memory (of their user experience) can be rehabilitated just as dramatically as it was decimated in the previous example.
Kahneman’s conclusion works for UX and app developers …


“We don’t choose between [user] experiences, we choose between memories of [user] experiences. Even when we think about the future, we don’t think of our future normally as [user] experiences. We think of our future as anticipated memories.”

Kahneman’s independent research offers some of the strongest evidence yet on the importance (criticality) of using stories in operations and support, app design, user training, and in product management.
Coming next: do apps have an experiencing self and a remembering self? You bet! (After all, they’re people too!)

Wednesday, February 8, 2012

Which came first, application development or the egg? … and other riddles of the day

Spoiler alert, the answer involves butterflies and trees.

Q: When a tree falls in a lonely forest, and no animal is nearby to hear it, does it make a sound?

A: Of course, the answer is No. Sound is vibration, transmitted to our senses and recognized as sound only at our nerve centers – If there be no ears to hear, there be no sound at all.

Q: BUT, when a tree falls in a lonely forest, and no animal is nearby – does it matter?

A: Yes and its impact goes beyond the sleeping caterpillar in its cocoon = Consider the Butterfly effect where a small change at one place can result in large differences somewhere else (the name comes from the example of a hurricane's formation being dependent on whether or not a distant butterfly had flapped its wings several weeks before).

Q: When an app crashes in the wild and no developer is nearby, does it create a work item?

A: Sadly, the answer is No. Work items are specific tasks, transmitted to a dev organization and recognized as a work item within an IDE like Visual Studio. If there be no IDEs, there be no work items.

Q: BUT, when an app crashes in the wild and no developer is nearby – does it matter?

A: Yes and its impact goes beyond the individual user inside your app = consider the operational, reputational and social implications of a crushed user and the impact that a small incident in production can have.

A production incident can result in massive user defections, cratered development ROI and operational failure. (Don’t make me go into “for the want of a nail…”)

The material distinction between the hurricane and the “operations storm” is that while we can only forecast the weather, with the right information, development (dare I say “devOps”?) can effect operations through AGILE practices.

Q: Which came first, the chicken or the egg?"

A: Of course, it’s the egg. Just ask the dinosaur back in the Triassic Period. The question as to which came first, the chicken egg or the chicken – well that’s a metaphysical question and has no place in a thinly veiled software blog like mine.

Q: Which came first, application development or operations?

A: Of course, it’s application development. Just ask the original time sharing providers back in the 60’s. The question as to which came first, the "development practices that are responsive to operational feedback" or operations is, in fact, one that I’m prepared to answer (as opposed to that chicken/egg deal).

Most applications today are deployed like the proverbial tree in the lonely forest – making no noise (because there are no developers around to listen) but whose crashes often reverberate across operations and then hit development like a hurricane.

Application Analytics is the emerging discipline plus supporting technologies specifically designed to connect application adoption, user behavior and production incidents to development practices, quality and impact.

Application Analytics is the evolutionary trigger that moves “the application” from the Triassic Period into modern times where cloud, mobile, web services and other forces are transforming our ecosystem.

If application analytics isn’t a part of your development process, well…. You just may end up in a mud pit with the rest of the dinosaurs.

Monday, January 9, 2012

Hoisted by my own petard: or why my app is number two (for now)

I have to admit that I have taken some small pride in the fact that my app, Yoga-pedia, has been the number one yoga app on the Windows Phone marketplace since its debut over the summer. Imagine my surprise when I checked the marketplace today and found another yoga app in the lead!

Of course I had to know what made this app so special and so I clicked through to check out the competition. OK, the cover art shows a barely clad buxom brunette in some faux pose – “it’s one of those apps” I said to myself; those soft-core apps that are all about titillation and little else.

Needing to satisfy myself that I had this app pegged, I quickly scanned the description… what’s this!? “No matter what your issue, there is most probably a pose for that” – that’s my line (after all, my paid app is “A Pose for That”). My eyes dropped to the screen shots – no way! – Other than the home page, the screen shots were lifted right out of my app!

This free app included the four yoga instruction videos only included in my paid app. Just to be clear, these videos feature my wife as the instructor, I filmed the videos (and even composed and recorded the music).

I’d been beaten by my own content!

Two things happened in quick succession; first, I got really pissed; and then I was awash in a flood of questions…

  • Who the F#$! is behind this? (and please let me meet them one day)
  • How did they do this? (and is there something I could have done to prevent it?)
  • What can I do about it? (and how much of my time is this going to suck up?)
  • Is this a common problem (if so, why haven’t I heard about this before?)
  • Why did they do this? (they don’t show ads and the apps are free)
  • What other apps does this publisher have? (and are they also stolen?)
  • And do I tell my wife? (because she is going to be even more pissed than me)
Who’s behind it? Well, I can’t say for sure – the company name has no other reference on the web that I could find – but they’re out of China and I am working on a few leads…

How did they do it? I believe they downloaded the XAP from the marketplace and while they couldn't take my code (it’s not in their app), they definitely lifted my resources (they are named identically to mine including spelling mistakes). Obfuscation/encryption can protect the code – but did nothing to shield my external resources (like the videos).

What can I do about it? Microsoft has an established process that I have initiated – I’ve been led to believe that they will act swiftly given the unequivocal evidence I was able to develop. If this is all there is to it, Microsoft has made the process straightforward (I will post more if it’s more involved).

Is this a common problem? I have no idea – can someone else share?
Why did they do it? I really don’t know – BUT the pirated version of the app uses
  • music and video library
  • phone identity and
  • data services
There is no reason to use these services to play my four simple videos – is this malware? Phishing? What are they doing with this app? I’ll have to take a closer look – I expect (hope) Microsoft will too.

What other apps does this publisher have? Some over-the-top soft-core apps and a collection of language apps – I suspect all of these are “resource-heavy” with little or no exposed app logic (so they are all stolen) – they are driving adoption for sure – but to what end?

And, last but not least, do I tell my wife? Well, of course I did and, yes, she is pissed – especially when I explained that there is no way we are suing anyone in China for copyright infringement.

At the time of this posting, the offending app is still live - but to be fair, it’s been 5 hours since I discovered the app, 4 ½ hours since I first contact Microsoft, 3 ½ hours since Microsoft gave me the contacts and process to begin the take down process, and 2 hours since I initiated the process.

I’m coming for you Ryan! (and you'd better hope that I get to you before my wife does)

POSTSCRIPT

The offending app has been taken down by Microsoft. It took 24 hours and, as I tweeted earlier, given the legal hoops I'm sure Microsoft had to jump through, I think that's pretty good.

On the other hand, the bad actor, Ryan Lan AG, still has 10 apps on the marketplace. I think publishers who so blatantly abuse their fellow publishers should be blacklisted. ...but that's just me. Ryan - you want to man-up and identify yourself?

Tuesday, November 29, 2011

The Microsoft sponsored service for WP7 ends – the PreEmptive sponsored service debuts

At 24:00 EST on December 9, 2011 the Microsoft sponsored protection and analytics service for Windows Phone 7 will be shut-off.

A different service fully and solely subsidized by PreEmptive Solutions will take its place. This service is materially different – please read the following notice carefully for information on how to continue to work with PreEmptive Solutions technology for Windows Phone.

Background

While Microsoft’s sponsorship expired on September 30, 2011, PreEmptive continued the service for an additional 60 days at our own expense while we explored a variety of options to continue our support for the Windows Phone development community. Microsoft’s sponsored service has ended, but our commitment and support for this community continues unabated.

PreEmptive’s challenge was to find an affordable means to support for the burgeoning WP7 development community without compromising the quality and capabilities unique to our protection and application analytics technologies; we believe the following provides both a valuable set of services at little and no cost for small WP7 development efforts with a smooth “on-ramp” for larger development projects and for organizations with more demanding service levels, governance or scalability requirements.

Summary

Obfuscation and Instrumentation continues at no cost through 12/31/2012.

Dotfuscator for Windows Phone, the post-compile tool that obfuscates and injects application instrumentation will continue to be offered to Windows Phone 7 developers at no cost through December 31, 2012.

Mobile analytics endpoint (wp7.runtimeintelligence.com) will be shut-off on 12/9/2011

The current analytics endpoint will be discontinued. However, developers have a number of options that they can consider;

· Subscribe to the PreEmptive Solutions commercial endpoint. This is a fee-based option that includes all of the features currently offered PLUS an advanced mobile portal, a RESTful API, and a higher service level (plus support beyond WP7). For more information, email sales@preemptive.com.

· License PreEmptive Analytics for TFS. This is also a fee-based option. This solution is an on-premises solution focused on exceptions rather than feature tracking. For more information, see Using Analytics for Windows Phone and Azure Exception Tracking - User Community Virtual Series and email sales@preemptive.com.

· Develop and host a homegrown endpoint. This is a no-fee option but development will be required. The CodePlex Runtime Intelligence Endpoint Starter Kit repository starter kit project may be of some help.

· Plan to migrate to the PreEmptive Analytics for TFS community edition to be included with Dev-11. This is a no-fee option but is NOT yet generally available from Microsoft. For more information, see the video A Lap Around PreEmptive Analytics for TFS with Justin Marks.

· Publish their app as a CodePlex project and utilize the CodePlex analytics endpoint (this is different than the option above). This is a no-fee option. For more information, see this tutorial (note that this assumes the developer is limited to the Community Edition of Dotfuscator – but the WP7 edition has full functionality).

The following feature summary table highlights the three principle options available to the Windows Phone 7 development community with a comparison to the discontinued Microsoft sponsored service. (click thumbnail to enlarge)


FAQ

Q: Will developers have to republish my WP7 app on or before December 9, 2011?

No

Q: Will users notice any difference in app behavior after December 9, 2011?

No

Q: Will I have to re-register my installation of Dotfuscator for Windows Phone 7?

No

Q: If I have only been using Dotfuscator for obfuscation, will I lose any functionality or will I have to do anything differently?

No

Q: Will developers have access to earlier runtime data generated by Runtime Intelligence for Windows Phone after December 9, 2011?

They will not.

Q: Where can developers ask additional questions regarding migration, upgrades or discontinuing use of PreEmptive Solutions technologies?

Post to the PreEmptive forum at http://www.preemptive.com/forum/index.php?f=26&sid=dfe90c2ba80de07692372dae962c58b2&rb_v=viewforum

PLEASE NOTE – this is NOT a moderated forum.

Q: Why would a development organization upgrade to a professional SKU of PreEmptive Analytics?

· Multi-platform (WP7, Android, JavaScript, all .NET and Java, native API…)

· Private endpoint (for large-scale enterprises with demanding scalability, governance, or other unique requirements).

· Analytics for TFS option (out-of-the-box integration with Microsoft Team Foundation Server).

· True application analytics such as custom data fields, development ownership of data, true SLA and support for developers, etc.


Conclusion

Of course we would have preferred that Microsoft had opted to extend their sponsorship for Runtime Intelligence for Windows Phone, but that was not the decision that they ultimately made. However, over the past 12 months, we had a front row seat watching a flood of innovative apps launch. We know that a good percentage of the WP7 development community relied upon PreEmptive Solutions for both analytics and protection (in a recent analysis of the marketplace, it was shown that 17% of all apps used either protection, analytics or both).

This experience combined with our confidence in the future of the Windows Phone platform has prompted us to extend free access to Dotfuscator for Windows Phone. We look forward to our continued support and participation in the growth and success of this exciting technology and marketplace.

Monday, October 10, 2011

60 days – déjà vu all over again?

Hi all – today I sent out a notice to registered Runtime Intelligence for Windows Phone users letting them know that a change would be coming to our service on (or perhaps after) December 9th. I have already received messages from some rather annoyed developers who feel like we are playing some kind of Machiavellian pricing game; the basic flaw in this view is that it presumes we sit in the Prince’s chair – which we do not.

First, let me start by stating categorically that we remain excited and committed to the Windows Phone platform.

Our approach to analytics has always been squarely focused on development organizations rather than on marketing; this is not a “spin,” rather, this approach informs and influences our product’s architecture and business model.

I’ll drill into this distinction in a moment, but first, I want to point out that it is this distinction coupled with our belief in WP7 as a platform and the value of our approach to application analytics in general that led us to invest in building out the WP7-specific service. While I cannot speak to Microsoft’s motivations (in any context, let alone this one), it is public knowledge that they funded this service so that it could be offered at no charge to the WP7 dev community (but now that’s no longer the case).

Why was this even necessary? Why couldn’t PreEmptive just give away our analytics and protection service like Google does?

“Marketing-centric” analytic services make their money off of your data – but first they have to cover their costs; the “back end” or analytics portal is where the majority of that “cost” sits. Today, Google or Flurry (or any other similar service) each rely upon web and other mobile platforms to generate the data volume that ultimately funds their backend service. At this early stage, WP7 app data can fund client API’s (perhaps) but is nowhere near the volume-levels required to pay for an entire service.

But there’s more – focusing exclusively on resalable content (and by extension, divesting from any requirements that do not) have profound feature and architecture implications.

Given a marketing-centric focus, you can readily understand why these solutions all share the following traits:

· Custom data fields and data types are limited in scope and volume (unique/heterogeneous data points cannot be easily rolled-up, sold or used to better target users)

· No built-in enforcement for opt-out policies – this is left entirely to the developer (if you do not provide user data to these services, you are of no value)

· No investment in analytics of software away from the presentation layer (this data has no relevance to advertising, profiling etc.)

· Software-specific data is only marginally supported – unhandled exceptions can be captured, caught and thrown exceptions are out of scope *same as above – does not contribute to monetization model.

· They own your data (privacy rules notwithstanding – the have full rights to monetize your data in any way they see fit). This is the entire reason they are in business – if they don’t own the data, how can they make money?

· They can provide their analytics software for free – since they have built a monetization strategy based on your data and do not invest in any development that does not directly contribute to that strategy, they can afford to give you the picks and shovels for free in exchange for the gold you produce for them (that’s big of them don’t you think?)

Conversely, focusing on application stakeholders as we do, we invest in features that do not contribute to a roll-up across companies and apps to monetize user preferences – in fact, some of these features can materially impede that objective – yet they are equally as important for developers who want to build better, faster and more effective software…

For example:

· Supporting custom data (app-specific fields and states) and data types (other than strings)

· Built-in exception tracking (unhandled, caught and thrown) to not only send you stack traces but provide insight into user experience and runtime environments (hostile or otherwise)

· Built-in opt-out policy enforcement (local, regional, cultural, legal and regulatory rules are so complex – serious development organizations need to centrally manage and reliably enforce compliance – could you sell a gun without a safety?!)

· Analytics away from the presentation layer (want to know how your Azure or other distributed services are performing and behaving?)

· AND LAST BUT NOT LEAST, you own your data. (given the heterogeneity and specificity of each application’s data – it’s value is exponentially higher to development stakeholders and proportionately lower in aggregate)

So what’s the takeaway?

With Microsoft, we invested in this mobile platform because we believed (and now we know) that it has significant value.

Given our focus on development rather than advertising, we have to innovate on both the technical and business ends.

We had hoped that our previous relationship with MSFT Windows Phone division had lasted a bit longer, but it is what it is.

We have a number of very interesting scenarios in mind that we think will prove to be both exciting technically and innovative from a business perspective – but we are not ready to discuss that yet (as soon as we can – we will).

If you don’t care about these added value features and don’t mind the strings that come with web/mobile analytics services like Google – then you should certainly use them. They are not flawed – they are just fundamentally different.

If you value the services we have been offering or have ideas on how we can improve them even further – PLEASE LET US KNOW…

Registered users will be getting a survey in the next 24-48 hours – please let us know what you think and what’s working (and not) for you.

As I've already said, we remain excited and committed to the Windows Phone platform.


(now i have to break to prepare my wp7 training materials; i've got a crew from my son's high school writing WP7 apps for independent study credit)

Saturday, August 20, 2011

SCHNEL! Or why patience is a virtue except when testing on Windows Phone

Mystery solved! As I had promised in my last blog entry, I added exception reporting to my two apps, A Pose for That and Yoga-pedia to determine exactly what was going on with the exceptions that the Microsoft Marketplace was reporting but I had never seen. I needed to know:

  1. The cause of the exceptions (the stack traces were too cryptic for me to figure out)
  2. How to fix the problem(s)
  3. Solve the mystery as to why I have never seen a crash even though there is little doubt that they are indeed happening out there in the wild. If I can’t be confident that my testing is complete, I can never be confident that my app will behave when in matters most – in production.

Remember these three objectives because you will be tested later.

Now, I know that my entries are sometimes kind of long – so here are the conclusions…. And if you want to know how I back them up – then (hopefully) you will enjoy the rest of the post.

(PLUS, there’s a teaser at the very end).

Conclusions:

  1. Always account for “loss of context” in WP7 apps – probably the try-catch is the best approach but I will defer to “real developers” for the specific strategy. At least with Silverlight, impatient users can always force your app into an invalidOperationException.
  2. Culture matters in both user preferences and user expectations (and therefore user satisfaction). If at all possible, represent all relevant cultures in your test populations. How do you know what the relevant populations are? Analytics of course…
  3. Software quality, user experience and user profile are all intimately connected. Systems that only monitor user behavior (marketing) or only profile software stability (debugging) or only profile runtime configurations (marketplaces) are inherently weaker than an approach that accounts for the influence that each has on the others.
  4. Without Runtime Intelligence (or another comparable application analytics solution), no development team can be confident in either the quality of their app or their users’ experience.

And here’s the how and why I have come to these conclusions…


HOW – first I had to add my own exception reporting.

Exception Reporting: Adding exception reporting with Runtime Intelligence is very simple. All I had to do was add one exception reporting attribute as follows (from within Dotfuscator for Windows Phone)


Note that in the properties of this attribute I am asking that the method ExceptionExtendedData method be run. A Runtime Intelligence system probe attribute works fine during normal operations, but if I want custom data after an unhandled exception, this is a more reliable technique. Here is the method that I put in the App class:

As a side note, if I wanted to track thrown exceptions or handled, I could place the exception attribute down at the method level to get much more targeted data. Anyhow, after this simple step, I deployed the re-instrumented app to the marketplace and (sadly) watched the exceptions roll in…


Runtime Intelligence Exception reporting
Logging into my Runtime Intelligence portal account and selecting the date range I was interested in and then selecting “Exceptions”, presents me with the following:


I can see the total exceptions over time; the type of exceptions (I am only getting one – and that seems like it might be good news) and I have a list of all of the specific exceptions on the right. Clicking on any one of these shows me the detail as follows:


The graphic above shows screen captures from three different stack traces.

Good news item 1 is that (unlike the marketplace stack traces), I can see the diagnostic message. This may not mean much to the serious developers who enjoy offsets and cryptic traces – but I need these to go back to MSDN and other resources to see what is really going on and what I can do about them.

It turns out that there were seven different exceptions coming from my app – BUT ALL OF THEM HAD TO DO WITH TIMING – not some error in my general logic (in other words, I’m not dividing by zero or trying to display a non-existent image, etc.). For some reason my app is getting vertigo in my customers’ hands and losing track of what page was current resulting in any number of “InvalidOperationException.”

Good new item 2 is that there is a pretty standard way to manage this behavior; the try-catch statement. I’m in no position to explain how this works, but visit the link above for a great explanation.

So with basic Runtime Intelligence exception reporting I have addressed my first two requirements; to diagnose my app’s problem and identify a fix. BUT – I have not addressed the deeper and perhaps more troubling issue of why I have never seen this problem myself – what’s this all about? If I can’t improve my quality control, I can never feel comfortable that my app will perform in the wild as it does for me.

Good new item 3 is that I have Runtime Intelligence to give me EVEN MORE context on my app and my users. The fundamental flaw in almost every exception handling solution I have ever seen is that they (by necessity) can only look at the app when exceptions occur – they are too heavy-weight and/or too invasive to run all the time everywhere – no so with Runtime Intelligence.

If you ONLY have exception data, you are robbed of one of the most effective diagnostic heuristics available – the process of comparing populations in order to identify material differences between them and thus leading to a likely root cause. This is the fastest and cheapest way to figure out why I had never seen a crash.

What I did next was to compare the set of users who experienced exceptions with the general population of users and myself – was there something specific about their phones? Their software? Their behavior?

It turns out that the answers to these three questions are no, no and YES!

Process of elimination: First, I compared the system data of exception users and phone with the general population as defined in ExceptionExtendedData defined above… I won’t bore you with all of the metrics I was able to eliminate, but I will show one; manufacturer.

The two pie charts show the relative percentages of manufacturers in the general population of my users with the population that had exceptions – one can eyeball these and pretty quickly see that there is virtually no difference. The bar chart puts a fine point on this by showing the relative difference in share; Dell had only 1% of the total share and was not statistically significant – looking at the other three manufacturers, we can see that there is no more than a 20% variance between the two populations. This kind of range was consistent across all of the metrics I had been collecting except one.

Schnel!

In my last blog I had noted that there had appeared to be a disproportionate percentage of German speaking users in the exception population and it turns out that this was not a random blip – it showed up again in this latest exception data as follows:


The top bar chart shows the relative percentage of users by culture that experienced exceptions alongside the relative percentage of that culture in the general population. The second bar chart shows the relative difference in share by culture and it is truly surprising (at least to me).

Germans crashed my app 13X more often than norm, Austrians and the Dutch crashed the apps 4X what their relative share would suggest with the Malaysians right behind.

Given the relative distance between these populations and the different carriers and jurisdictions that these populations live under, it seems pretty clear that what these users have in common is their behavior. These users are simply more impatient than the rest of my users. They hit the “show pose” or “take me to the marketplace” or whatever more quickly and more often and so they are that much more likely to cause my app to lose its place.

Not only am I more patient (being an American and at one with the universe ;), but because I know my app and the areas where it may take a beat (or two) to respond – I naturally did not repeat my commands impatiently at those critical times – and therefore, I did not crash my app! Mysteries solved!

Conclusions: (AGAIN)

  1. Always account for “loss of context” in WP7 apps – probably the try-catch is the best approach but I will defer to “real developers” for the specific strategy. At least with Silverlight, impatient users can always force your app into an invalidOperationException.
  2. Culture matters in both user preferences and user expectations (and therefore user satisfaction). If at all possible, represent all relevant cultures in your test populations. How do you know what the relevant populations are? Analytics of course…
  3. Software quality, user experience and user profile are all intimately connected. Systems that only monitor user behavior (marketing) or only profile software stability (debugging) or only profile runtime configurations (marketplaces) are inherently weaker than an approach that accounts for the influence that each has on the others.
  4. Without Runtime Intelligence (or another comparable application analytics solution), no development team can be confident in either the quality of their app or their users’ experience.

TEASER – WOULDN’T BE AWESOME IF WE COULD DO ALL OF THIS PROFILING AND EXCEPTION ANALYSIS WITH HTML5/JAVASCRIPT TOO? STAY TUNED (IN)!

Friday, June 24, 2011

Improving Ad performance: Correlating ad activity with feature usage and user behavior

In this third installment on application analytics patterns and practices I’m going to focus on how Runtime Intelligence can be used to shed light on Ad activity within the context of one or more applications. While the use cases covered here are nowhere near exhaustive, I’m going to show how to answer the following questions (and hopefully give some indication as to why you may care about the answers):

  • What are ad impression volumes across multiple apps?
  • What are the click-through rates (the ratio of users clicking on ads to the volume of impressions) across various pivots?
  • What influence does culture (country of origin) have on click-through rates, e.g. are Germans more or less likely to click on ads versus Italians?
  • What carriers/ISP providers are giving me the most business, e.g. where are my users most likely to be found?
  • Where are users spending most of their time inside an app? Does that usage pattern correlate with a user’s likelihood of clicking on an ad?
  • Do returning users interact with ads differently than first time users or power users?
Many of these metrics are valuable in scenarios other than ad effectiveness of course (knowing where users spend their time and understanding how power users behave are two obvious examples), but for this installment, I am going to focus exclusively on how Ad interaction can be viewed across these metrics.

Implementation
I'm using the same trusty one line method WhatPoseWhen that I described in the first installment – this time, I call the method on the New Ad event (to count impressions) and the Ad Engaged event (to count clicks on ads). I could just as easily collect data on any other ad-related event and grab any data that is available to the program at that point in its execution as well. Here is the code for that method in its entirety:


private void WhatPoseWhen (string page, string selection)
{ return; }

The first parameter tells me from which page the method is being called and the second parameter tells me why I might care, e.g. was a new ad displayed, etc.)

I pass the page name and the ad event into WhatPoseWhen and Runtime Intelligence grabs these parameters and sends them up to the repository (no programming for this). I can then correlate the ad activity within the context of sessions, feature usage, and runtime stack data that I am getting as a part of runtime intelligence.

For these metrics, I export my CSV data into a regular excel spreadsheet and then generate the pivot tables shown below.

App background
I always like to use data from true production apps rather than fabricate data sets; I am using two apps that I wrote and launched on the marketplace that are both ad driven, Yoga-pedia and A Free WPC Yogi – the former is a free version of a yoga app that (hopefully) helps to drive sales of a for an upgrade to A Pose for That. A Free WPC Yogi plays a similar role for The WPC Yogi, a tailored version of A Pose for That targeting WPC 2011 attendees.


The following post uses their Ad activity over the same one week period.

Impression counts
The following pie chart shows the “new ad” event count by application. As you can see, Yoga-pedia has roughly 4X the number of ad impressions and given the fact that these apps are very similar (but not identical) in their behavior, this also roughly correlates to the volume of usage as well.


Click-through rates
However, when I divide the total number of “ad engaged” events by the total number of “new ads,” I see that A Free WPC Yogi has a 28% higher click-through rate (1.78% versus 1.37). In point of fact the demographics of the app users are quite different (randomized consumers versus MSFT partners who are attending WPC 2011).


Advantage: This intelligence helps to segment users by differences in their behavior and to do a better job of targeting those differences across apps.


Impressions by country (or culture)
Runtime Intelligence can grab the IP address of the sending tower – this is not personally identifiable and cannot be used to locate an individual with any precision – but it is more than adequate to identify country, state, and city. In the following graph, I simply count new ad events by country and show the top 10 countries by impression volume.


Advantage: If your app has a cultural bias that would benefit from localization, understanding where your users are can help prioritize those localization efforts.


Click-through rates by country (or culture)
The following bar chart calculates the click-through rates for the top 10 countries listed above. What is interesting here is that there appears to be a significant difference in click through rates by country (culture).


Advantage: Understanding when/if users from specific cultures are significantly more likely to respond to (click on) ads can further help to prioritize localization or marketing investments.


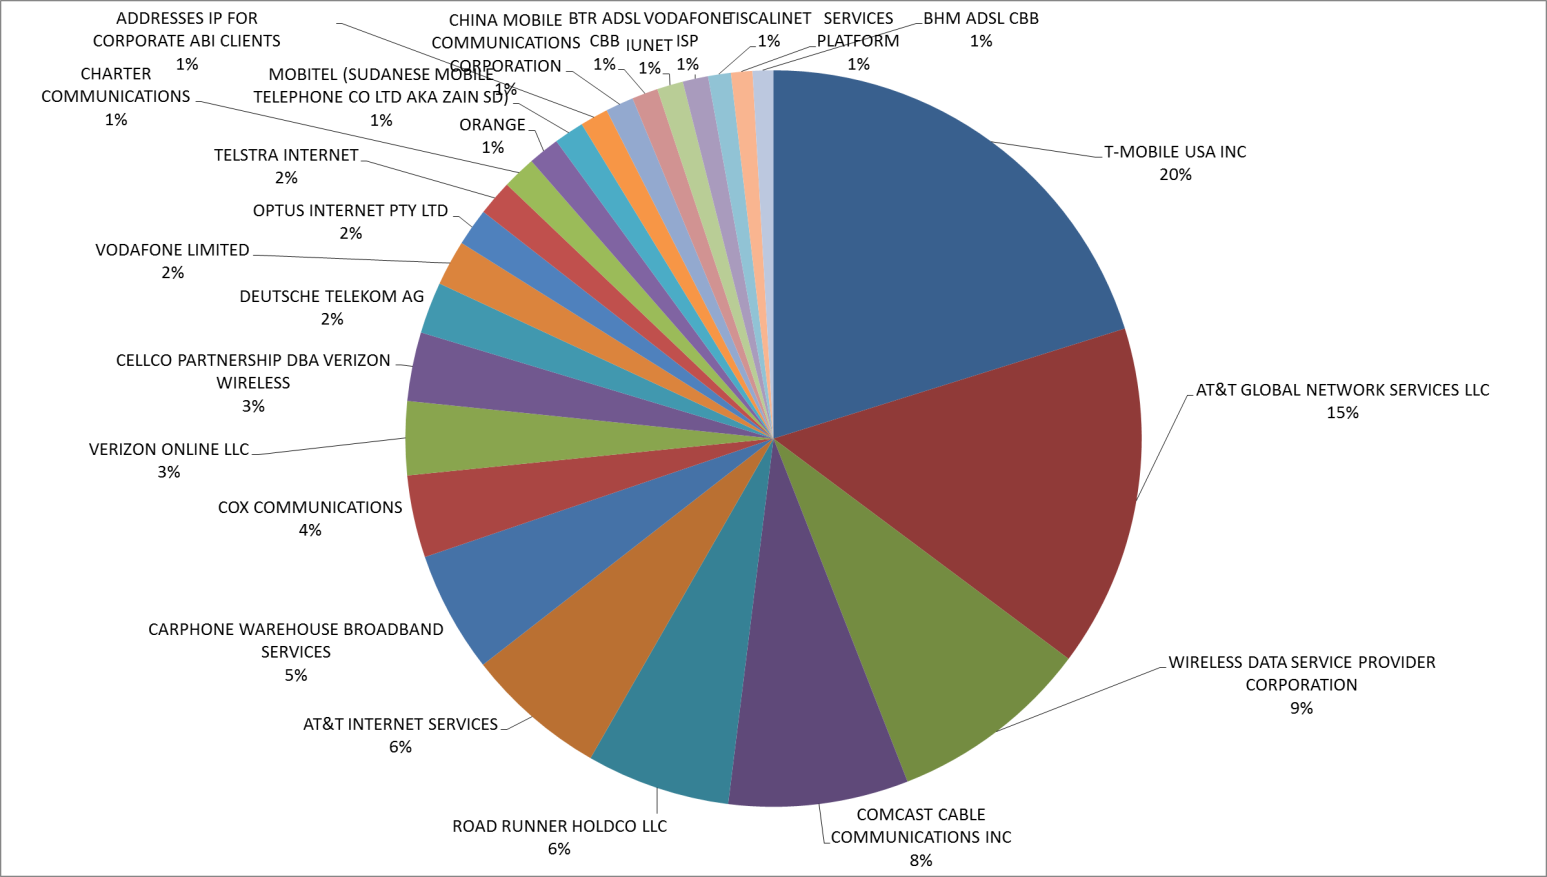
Impressions by ISP provider (top 25)
To produce the next graph, I used an application to tell me who owned the IP addresses that my mobile clients are using (I used IP2Location – but there are many of them out there).

This is a nice way to see who my users favor in terms of their carrier. Here I only show the top 25.

Advantage: Understanding carrier popularity will help focus business development/marketing efforts and better manage potential risks associated with how your users may be negatively impacted by upgrade schedules (delays). Will your next app be dependent upon Mango?


Sessions per app page
In the raw CSV files that can be exported from the Runtime Intelligence portal, there is a column, ApplicationGroupId. The value in this column is unique for all signals (messages) that are sent from within a single app session. In other words, I can use this field to organize all user activity into the relative user sessions using this field. This is helpful for plotting specific user patterns.

The following graph simply counts the unique occurrences of ApplicationGroupId values by page name value (recall that this is the first parameter of the WhatPoseWhen method). This avoids counting multiple views of a single page within a single session and tells me how popular specific pages are across my user base. For this posting and for illustration, I’m only showing data for five specific pages.


FindAPoseDetail and BrowseSelectPose are central to the user experience (browsing for yoga poses and then drilling into a specific pose for detailed imagery and instruction). TellMeMore is the page where I describe what comes with the paid version of the app (nice to see that 10% of my users deliberately choose to investigate the upgrade possibility) and AppGuide and TopicList are essentially app documentation and I can see that these pages are not hit very often – and that’s not a bad thing – users should not need to use the documentation after their first use.

So – this graph is telling me that

a) My users are spending their time using the app rather than trying to use the app
b) I am at least getting my user’s attention regarding a possible upgrade – perhaps my content is not compelling enough if my conversion rate does not correlate.

Advantage: broad user proofing can be used to validate developer assumptions about user experience and effectiveness of pages for their specific purpose.
Ads shown per page compared to volume of times viewed
Next I calculate the average number of ads shows per page by dividing the total count of New Ad messages by page (this combines the two parameters, page name and the even New Ad) by the total count of the times the page is shown. TOTAL ADS SHOWN PER PAGE / TOTAL TIMES PAGE VISITED

I use the same ad duration interval across all of my pages – so this is actually another means of calculating how much time my users are spending on each page (this can be done with Runtime Intelligence alone, but in this case, I don’t have to do that).

The graph below shows the average number of ads shown per page and maps them to where they rank in terms of how often the page is visited.


Happily, the two core pages of my app also get the most ads (and are also where my users are stopping to spend time). I can also see that users spend more time on detailed pose descriptions than they do browsing – even though the browse more often than they drill down (which makes perfect sense).

Sadly, my upsell page is getting the least love – I definitely have to work on making this page more engaging.


Advantage: Ad frequency by page provides insight into where users spend their time. Calculating click-through rates by page identifies where users stop to look around and may be most open to suggestion.

Returning users and sessions per user
Another column in the CSV extract is the ANID – this is either the result of hashing the true ANID from a user’s phone (it is not the actual ANID value), or, if they opt-out of that, it will contain a GUID generated by our software and written to isolated storage. In either case, this value acts as a unique user identifier.

The ANID can be used to identify new and returning users. Dividing session count (ApplicationGroupId) by ANID gives the average number of sessions per user. The following bar chart takes the 10 ANIDs with the highest session counts and compares the resulting sessions per user value to the rest of the user base (whose count is roughly 500 other users).


What I see is that there is a core group of users that are heavily using my apps (YAY!). Now that I know who they are, I can zero in on their specific behaviors, how they relate to my ads, what features they use most heavily, etc.


Advantage: Segmenting users into new, returning, and power categories dramatically improves a developer’s ability to target, prioritize, and validate development, marketing, and support activities.

Conclusion

I hope to have shown how using Runtime Intelligence, developers can materially improve their ability to build more effective applications and refine their advertising strategy while coordinating that strategy with complimentary upsell strategies as well.


Advantage: Development!

Tuesday, June 14, 2011

Increasing App sales with Analytics: Free apps versus trials

In my previous entry I introduced my app, A Pose for That, explained how I had instrumented my app with Runtime Intelligence to better track user experience and behavior. As a case in point, I illustrated how strategically placing upgrade opportunities in various locations inside my trial version, I was able to increase my conversion rates – perhaps by as much as 50%!

HOWEVER, when I was at MIX11, a very experienced developer (let’s call him David because that’s actually his name) told me that he had already established the optimal app blend to maximize revenue – it was to have a free app (not a trial version) that also offered ways to upgrade to the premium app. He pointed out that trial apps do not show up as free in the marketplace and are therefore almost always overlooked by most casual marketplace browsers. A free app gets the eyeballs that a trial misses.

For those who know me, they know one of my core principles is that my ideas never have to be original, they only have to be good – so is David’s idea really a good one?

To test it out, I created Yoga-pedia, a free app that included the browsing capabilities of A Pose for That with good imagery and instruction, but did not include the pairing of poses to real-world situations (a feature I believe is valuable) or flows (the stringing together of multiple poses). On the welcome page (and one or two other places) I give users a chance to learn more about our software and upgrade; Here is the welcome page and the “tell me more about why I should upgrade page.”


I instrumented the various points where users can upgrade in both the trial and the free app so that I can compare BOTH the usage levels of the two apps AND the upgrade requests that stem from that usage. So… let’s go to the video tape – or better yet, Runtime Intelligence. (Note – these specific graphs are built by extracting the data from the runtime intelligence repository into a spreadsheet and then generating a simply pivot table).

By looking at application starts (not downloads in the marketplace sense of the word), the graph showing App Runs seems to support David’s logic; my free version, Yoga-Pedia, takes off like a rocket and within 24 hours eclipses trial activity in dramatic fashion. …but, it also seems to be cannibalizing trial activity too – Should I care? (NOTE – I am combining usage of multiple applications – not always easy to do with canned dashboards)


I probably should care IF users are more likely to upgrade from A Pose for That trials versus from Yoga-pedia. In other words, are my sales going up because of the free app even though it is depressing my trial volume? Let’s go to Runtime Intelligence one more time…


What the graph above shows is that upgrades from my trials also decreased dramatically with the launch of Yoga-pedia, BUT the volume of upgrade requests from within Yoga-pedia more than made up for that shortfall. (NOTE – I am combining feature usage across multiple applications – not always easy to do with canned dashboards)

In the one week where both the free and the trial versions lived side-by-side, the free version generated 86% of the upgrades.


More important is the bottom line: I saw an 85% increase in the total number of upgrades when I had the combination of both a free and trial version of my app available.

Coming up next (I promise this time) will be a discussion of the last leg of David’s magic formula for success – making your free version ad-driven. What will Runtime Intelligence be able to tell us about that?